
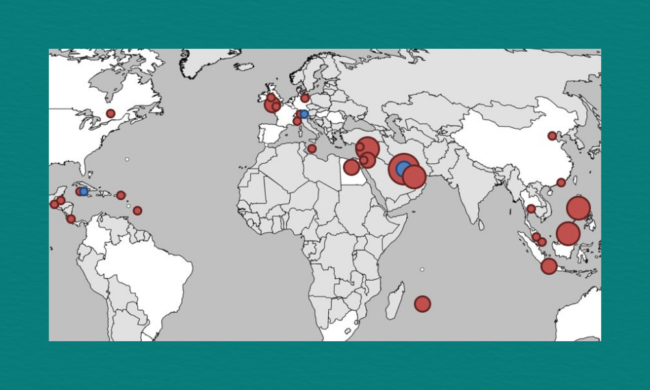
A new map of financial transparency reform: 2000-2015
GI-ACE researcher Daniel Haberly’s first project workshop, “Dark Architectures: Advancing Research on Global Wealth Chains,” provided an opportunity to present in detail on the preliminary version of the historical financial secrecy database compiled over the past several months, including a preliminary overview of how the world map (in 61 jurisdictions) of secrecy-related regulation evolved between the years of 2000-2015.